Every company has two organizational structures: The formal one is written on the charts; the other is the everyday relationship of the men and women in the organization.
American businessman 1910-1997
The Conway law states that companies implement systems reflecting their communication structure. This structure is commonly represented as an organizational chart that must be updated after every reorganization or restructuring. In practice, companies are often stuck in endless reorganizations, and their organizational chart becomes quickly outdated. Do we need this organizational chart?
The Pros and Cons of Organizational Charts
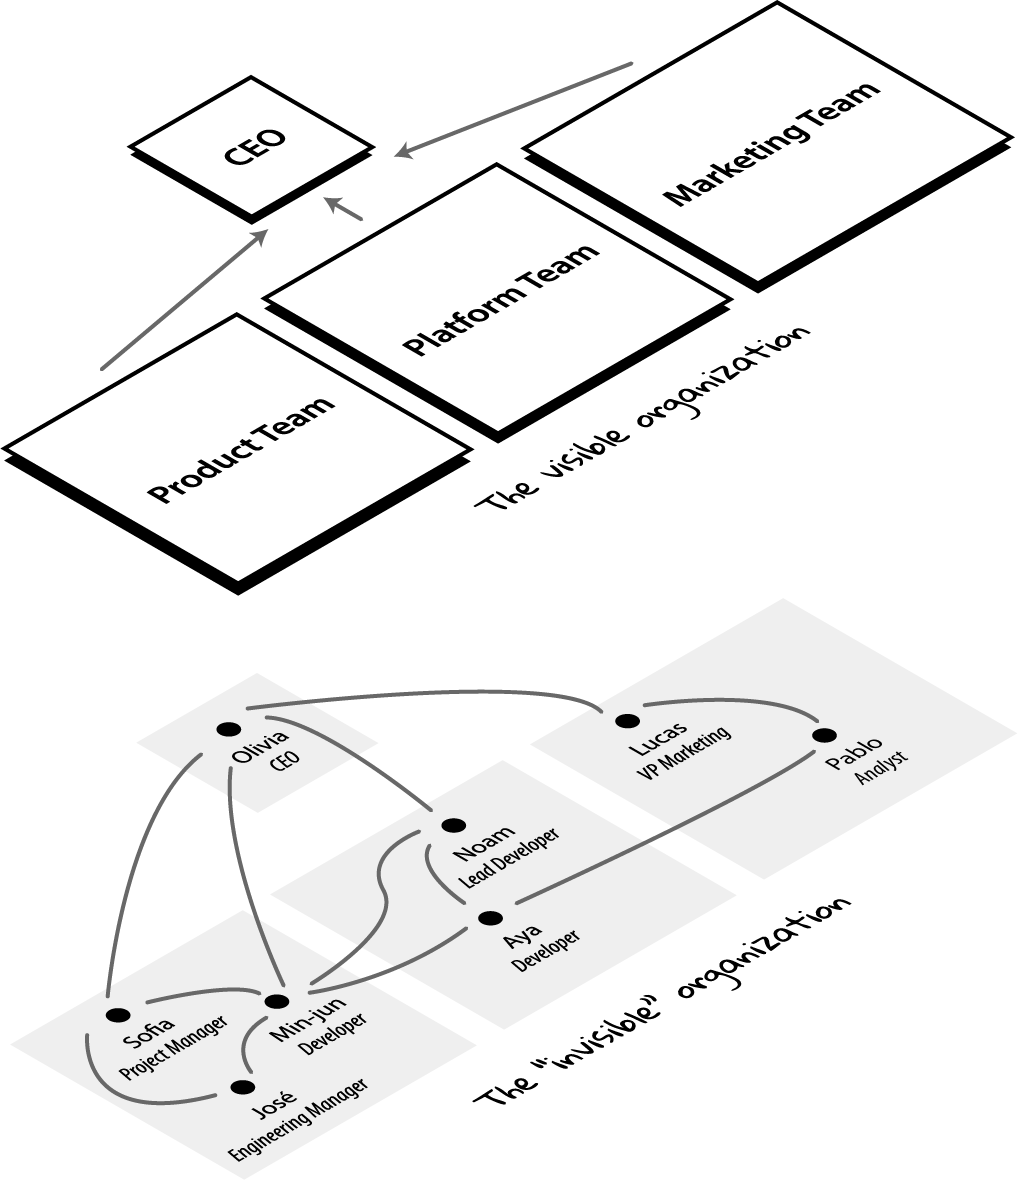
An organizational chart illustrates how formal communications happen inside an organization, how a manager higher in the ladder spreads information, and how employees on the lower rung report to them. By grouping employees in boxes, called teams, an organizational chart also forces communications to happen. You are more likely to exchange with your teammates than with other employees, at least if you consider only formal meetings like daily standups or retrospectives.
But an organizational chart says nothing about the invisible organization where crucial, informal communications happen. Employees nurture relationships — at lunch, during incidents, at the coffee machine — that help them overcome problems and solve challenges in their daily tasks. These informal interactions illustrate your culture, and using a tree model like an organizational chart cannot depict such a complex social network.[1]
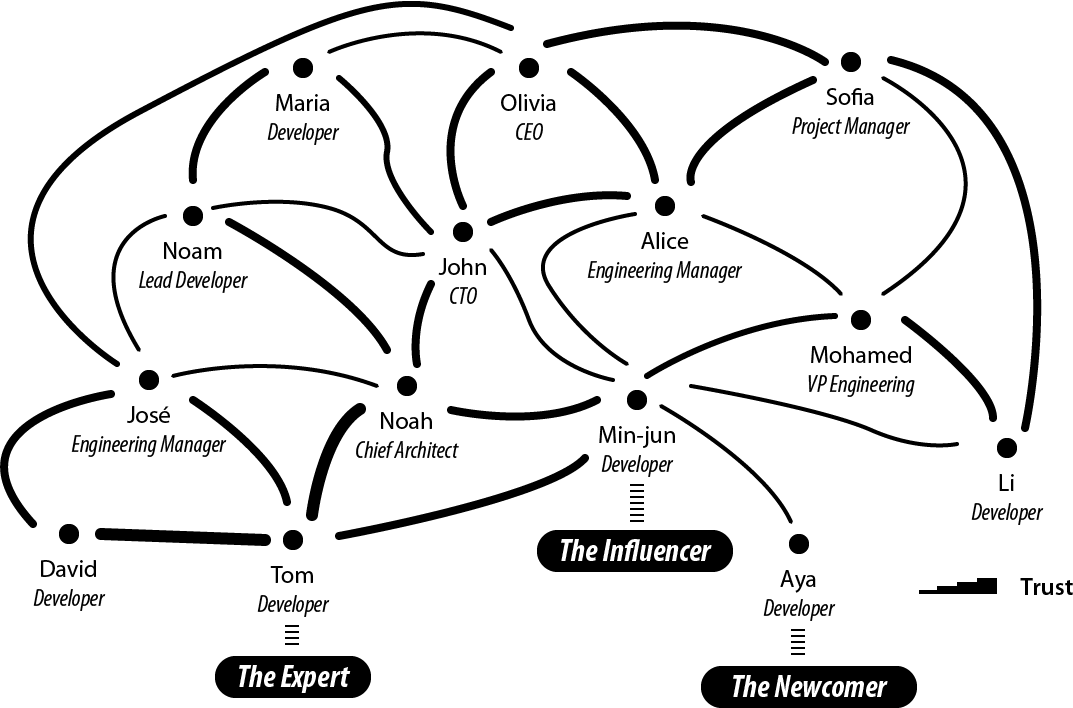
Researches show that leaders who understand this informal structure are more successful. The organizational chart (formal structure) highlights the divisions, while the social network (informal structure) highlights the interactions. As explained in a previous post about complexity, complex systems are mostly defined by their interactions, not their structure. Holism (the whole is greater than the parts) beats reductionism (divide-and-conquer) in management.
This social network explains, for example, that employees are not interchangeable. You cannot replace an employee having complex interactions nurtured over time by a fresh one completely disconnected in this network on his first workday, even if they have the same skills.
Therefore, an organizational chart is not the more accurate description of your company. But completely removing it would be a mistake…
Goodbye Organizational Charts?
Removing the organizational chart is wrong, especially if you fail to replace it with something more helpful, more actionable.
For example, saying, "We don’t need a hierarchy. We are all together in the same boat. We are one big team" sounds appealing. I like this metaphor. But this simplistic model is useless. You need everyone to row in the same direction to reach the destination.
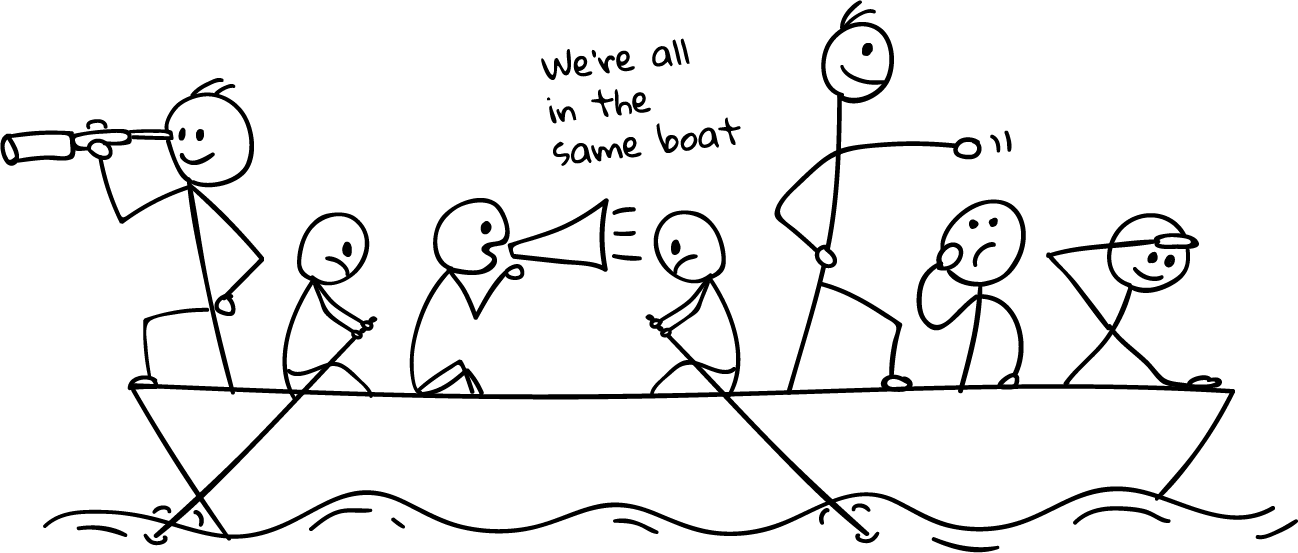
The metaphor hides the reality:
-
We don’t want all employees to communicate with everyone else. No work would be done at all! Humans can only manage a small number of relationships.[2] So we must limit their interactions if we want these relations to grow rich.
-
We still have decisions to take to reach the destination. The all-in-the-same-boat metaphor simply says that someone in the boat has to make them. Not very helpful. We need to figure out how to solve the inevitable decision conflicts when more than one brain is working on a problem.
Let’s take a practical example to illustrate this last point. Imagine that the marketing department is asking for a new feature on your flagship product. But the product team has a divergent opinion. Who must have the last say? Based on the boat metaphor, it’s not clear.
Analogical Thinking
To continue with the previous example, several options are possible. What follows is the organizational chart of this fictive company.
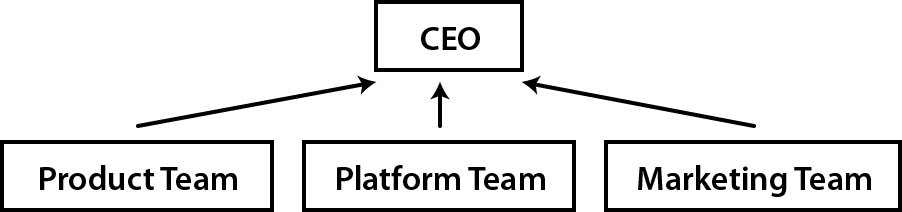
Analogy 1: The parenting analogy
The first approach is the classic example of top-down management. The Product team and the Marketing team expose their conflicting opinions to the CEO, which arbiters the final decision, like when two children complain to their mother because they want to play with the same toy
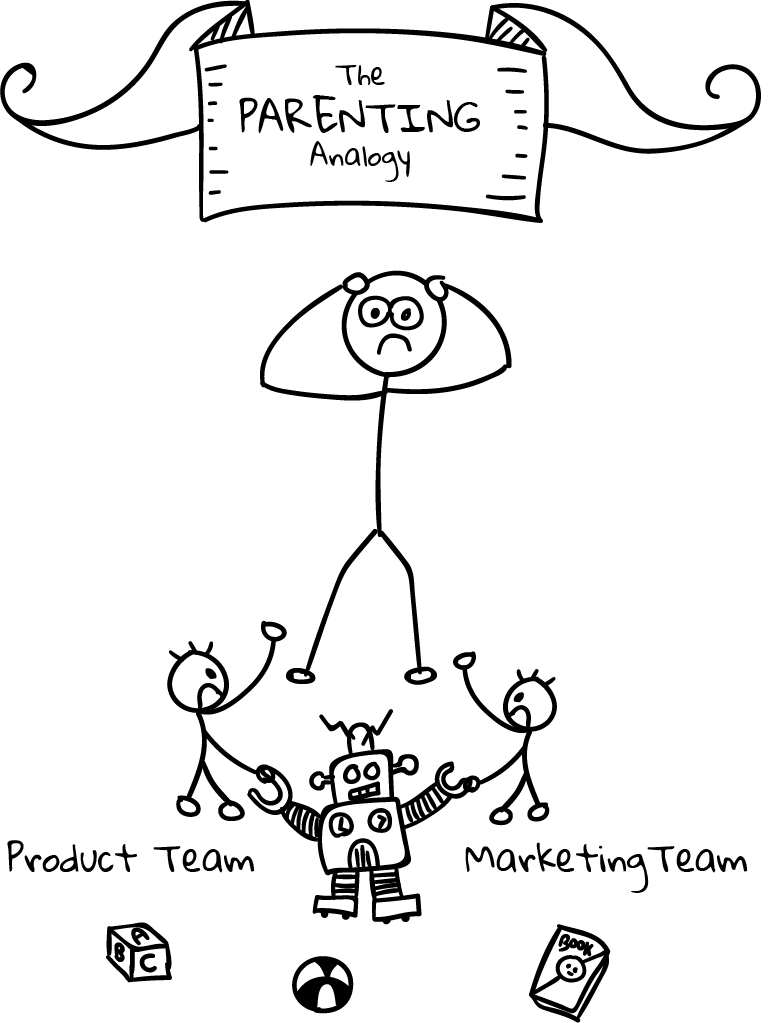
Few companies will admit they decide like this, but most are doing it. A better alternative is to empower one of the two teams to make the decision.
Analogy 2: The puppeteer analogy
You may decide that the marketing department is better advised and thus can make more informed decisions. In case of disagreement, the marketing must determine what to include or not in the products. This strategy makes sense but let’s try to find an analogy to illustrate this approach.
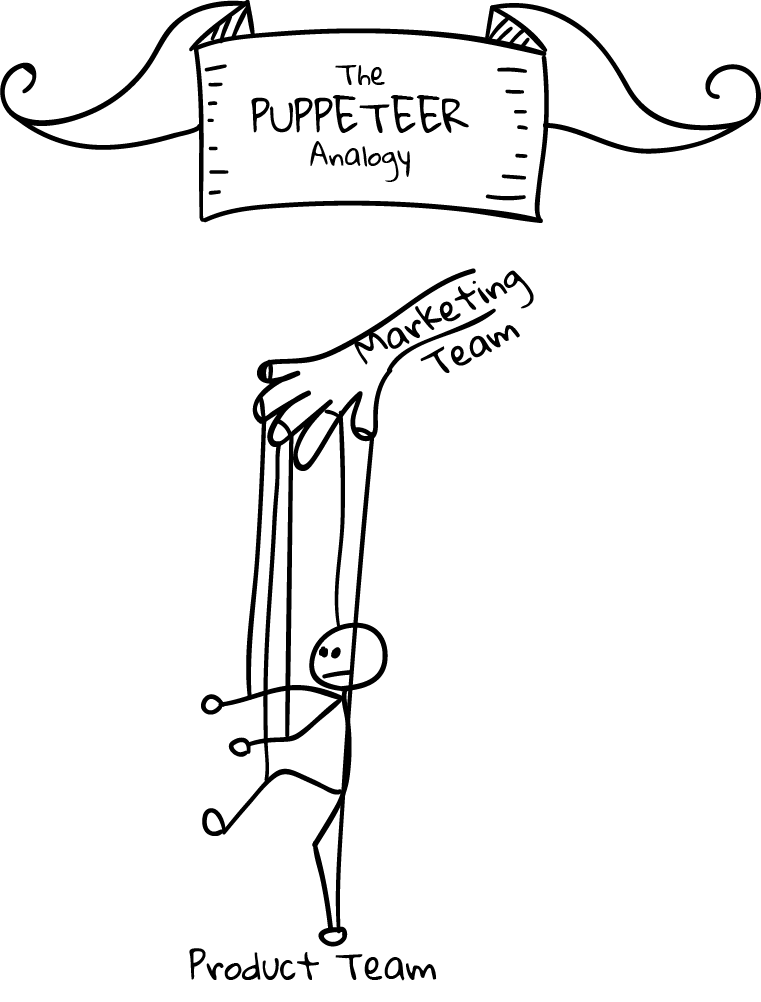
Depicted like that, that approach does not look great. You will not create strong product teams using this approach. And what if the marketing analysis were wrong. We have plenty of examples where customers didn’t really know what they wanted. Henry Ford captured this idea with his quotation: “If I had asked people what they wanted, they would have said faster horses.” Apple is famous for bringing products to the market that nobody asked. Therefore, if innovation is key to your business, you need to reconsider your decision-making approach.
Analogy 3: The turbine analogy
Innovation happens when you are facing a problem. It’s a bottom-up process, and you must empower your product teams to make the right decisions.
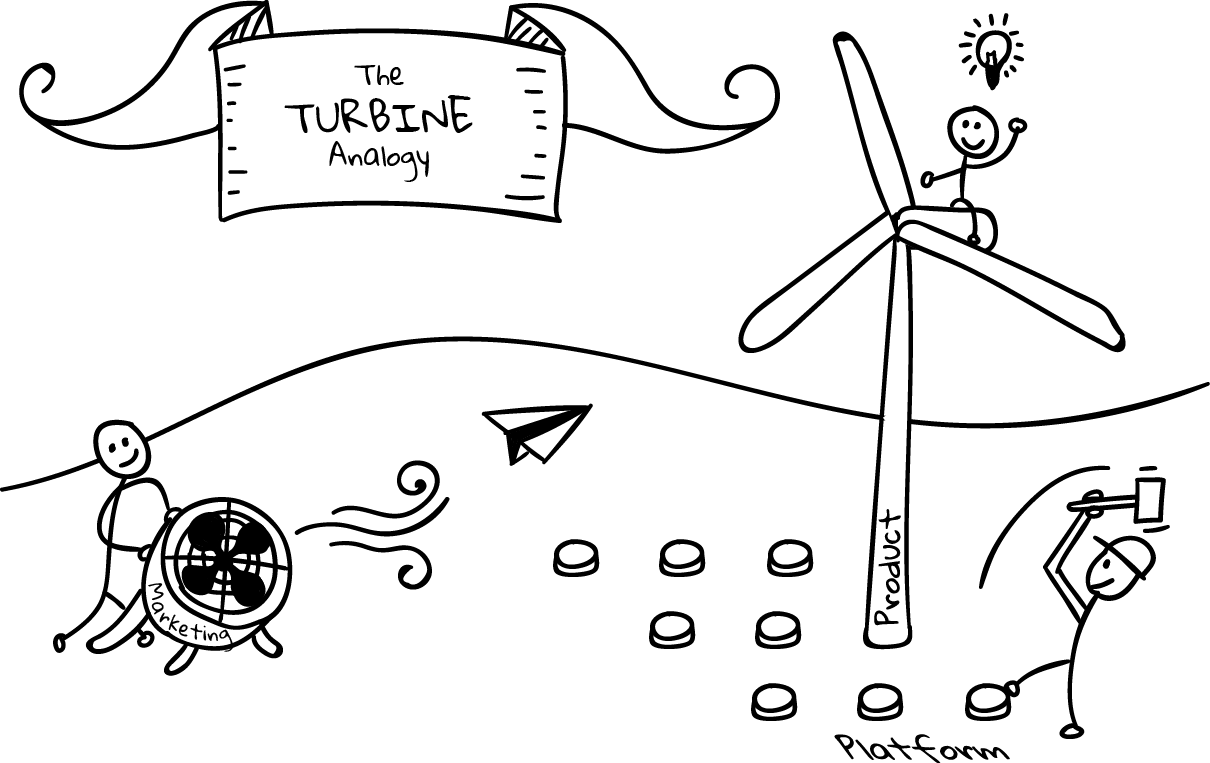
Product teams are giant wind turbines. The goal of your company is to make the turbines rotate as fast as possible. The marketing team acts like an air ventilator, providing the market analysis the product team needs to make well-informed decisions. The platform team acts as the soil on which the turbines can stand firmly. And the product team acts as the rotor, making continual adjustments to keep the turbines running as fast as possible.
Using this analogy, it becomes obvious who must make the decisions. The product team is empowered to do its job, one of the main motivation factors at work.[3]
Note that all analogies presented in this section are perfectly compatible with the initial organizational chart. It illustrates once again that organizational charts are incomplete. It’s a great tool to communicate the structure, but not the interactions.
To sum up
In the same way that you cannot understand the human body by observing its skeleton, you cannot understand how a company is working simply by looking at its organizational chart. But learning about the human skeleton is valuable. You still need your organizational chart. Any company has a global structure, and you had better represent it as clearly as possible.
What we learned in this article is that you need to complement your organizational chart with other tools that focus more on the interactions. Using analogies is a great idea to foster the interactions you want to observe more, but make sure they reflect a reality and not an impossible ideal.

About the author
Julien Sobczak works as a software developer for Scaleway, a French cloud provider. He is a passionate reader who likes to see the world differently to measure the extent of his ignorance. His main areas of interest are productivity (doing less and better), human potential, and everything that contributes in being a better person (including a better dad and a better developer).
Read Full Profile